


It's time for another market update! These are the current stats for the Elizabeth City, NC residential market.
Let's dive into these real estate metrics to gain a better understanding of how they correlate with each other.
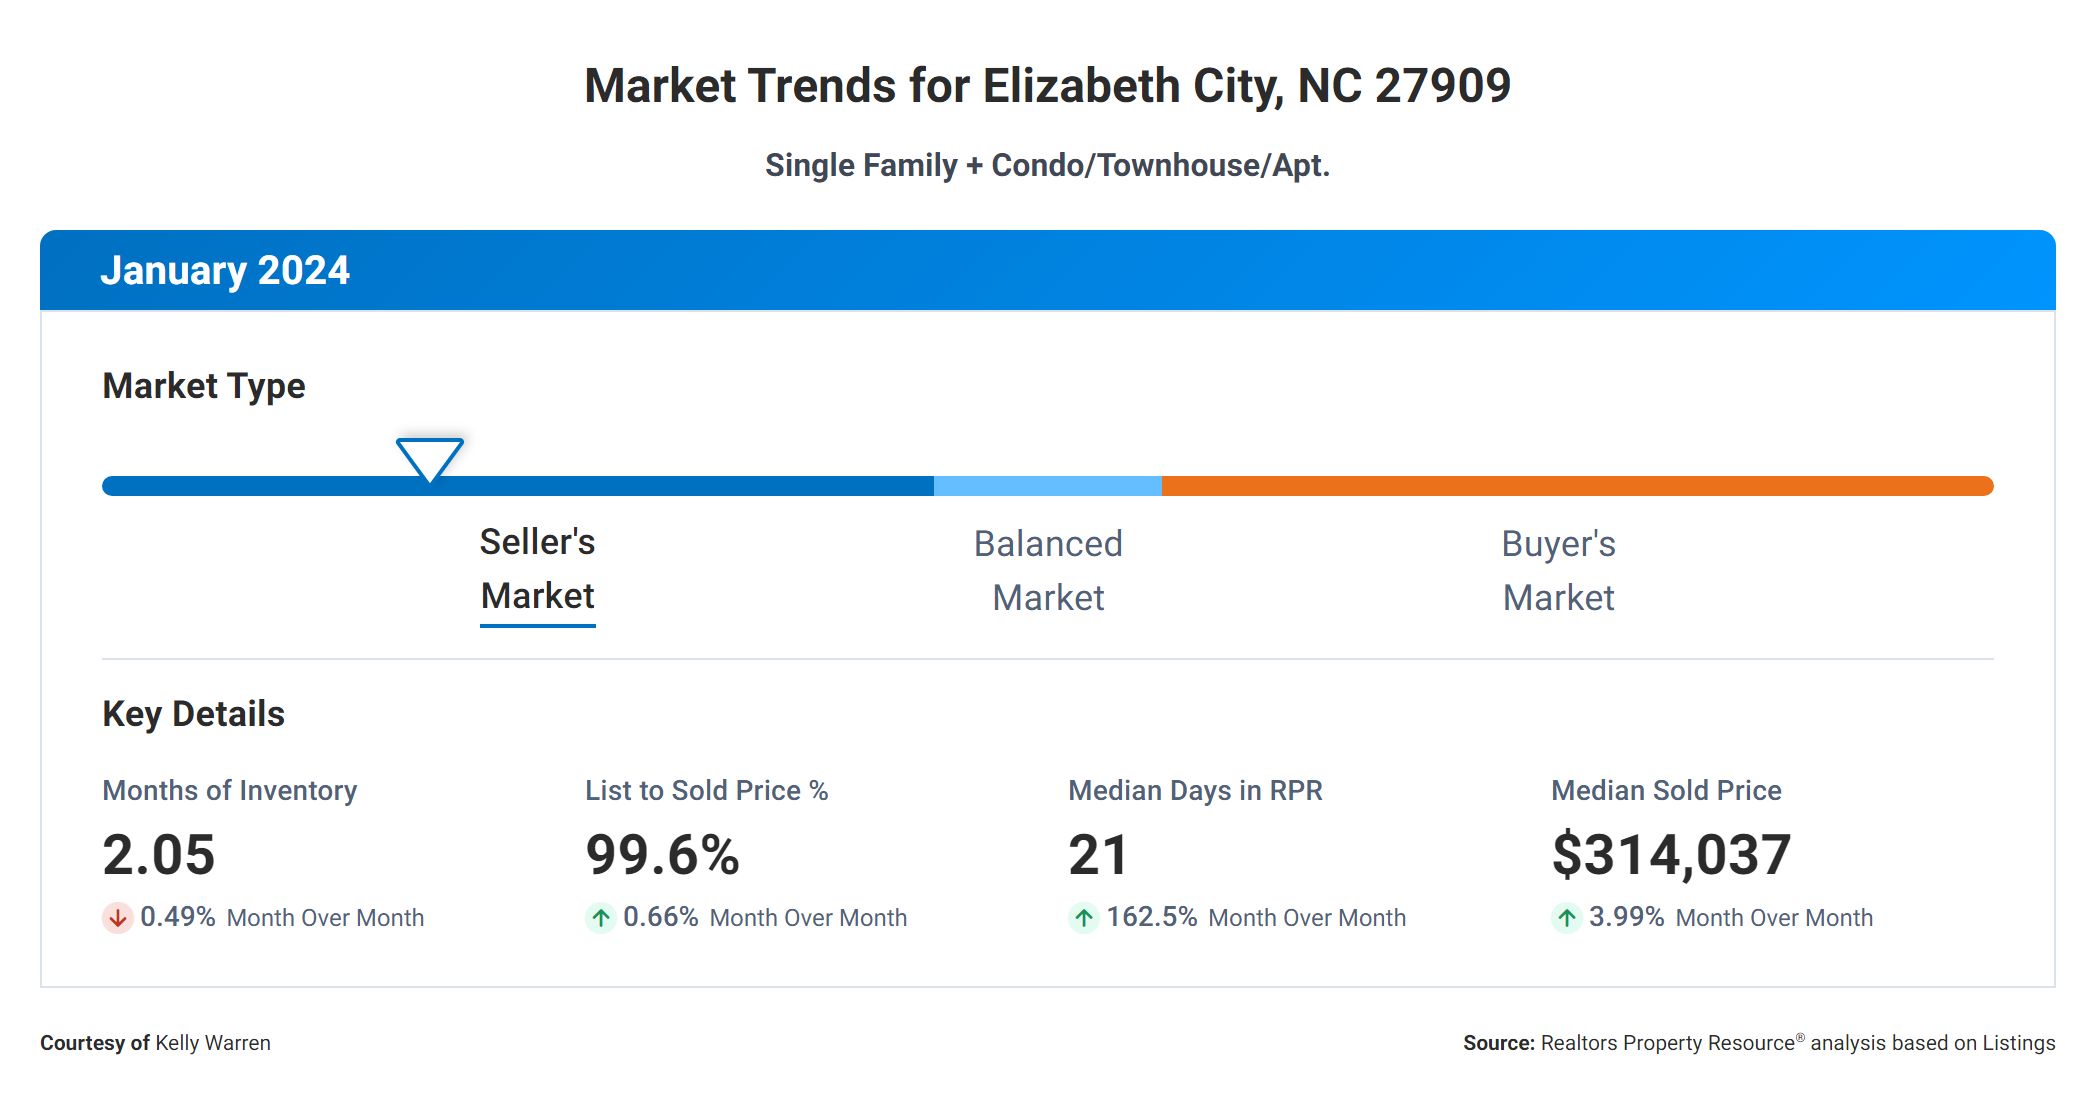
First, let's look at the Months' Supply of Inventory, which is currently at 2.05. This number tells us how many months it would take to sell all the homes on the market at the current pace of sales. A lower number (between 0-5) indicates a seller's market, where buyer demand is higher than the amount of listing supply.
The 12-Month Change in Months of Inventory is at +38.51%, which means that there has been a significant increase in the supply of homes on the market over the past year. This could indicate a shift towards a more balanced market, where supply and demand are more evenly matched. However, current levels still indicate a seller's market overall. The current seller's market is just not as severely overpowering as it was 1-2 years ago, which is some good news for buyers.
Next, the Median Days Homes are On the Market is 21. This metric shows us how quickly homes are selling in the current market. A lower number suggests a fast-moving market with high demand.
The List to Sold Price Percentage is at 99.6%, indicating that homes are typically selling very close to their asking price. This could be a reflection of strong buyer demand and competition in the market. When sellers properly price their homes within the market, this contributes to a higher list to sold price ratio because buyers are able to see enough value in the home to make the purchase at (or very near) asking price.
Lastly, the Median Sold Price is $314,037. This number represents the middle price point of all homes sold in the area. It gives us a good idea of the overall market value and trends in pricing. The median sold price is up nearly 4%, month-over-month, which indicates that prices are continuing to rise slowly in the area.
When we put all these metrics together, we can see that there is a correlation between the Months Supply of Inventory, the 12-Month Change in Months of Inventory, and the Median Days Homes are On the Market. The increase in inventory over the past year may be leading to slightly longer days on the market, but homes are still selling quickly and for close to their asking price. The strong demand and competitive pricing are likely driving the market forward.
For buyers, this data suggests that there may be more options available and potentially less competition for homes. For sellers, it's important to price competitively and be prepared for a slightly longer selling process. Overall, these metrics paint a picture of a dynamic and evolving real estate market that is worth monitoring if you are thinking of buying or selling anytime soon.
